Problem Introduction
The problem is about making a height map. Let’s say we need to create a decently accurate representation of the mountain range. Obviously, we cannot take the heights of every point on the map, as this would be very time-consuming and would never end as distance can always be reduced. We must record as many points as we can interpolate from the rest. Interpolation is used when we are attempting to fill in the gaps in a discrete data set. A good example is the n! graph. By definition, it is not possible to have 5.2! However, we do the values of 5! and 6!. We know that 5.2 must be a value between the two and closer to 5. If a point is close to a tall mountain and far from a small mountain, it is more likely that the height at the point will be quite high. It also has a lot of applications in computer graphics.
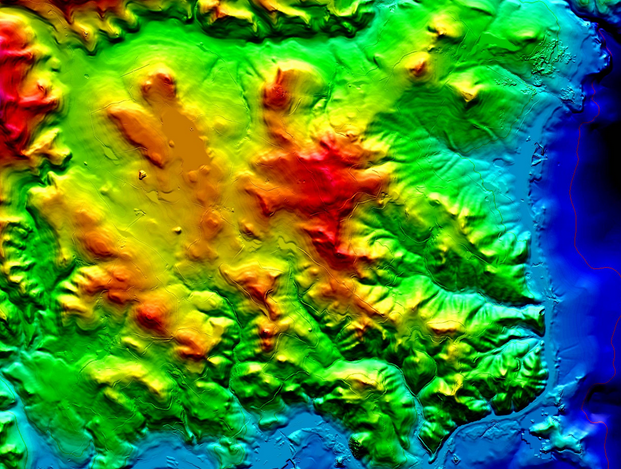
Interpolating Heights:
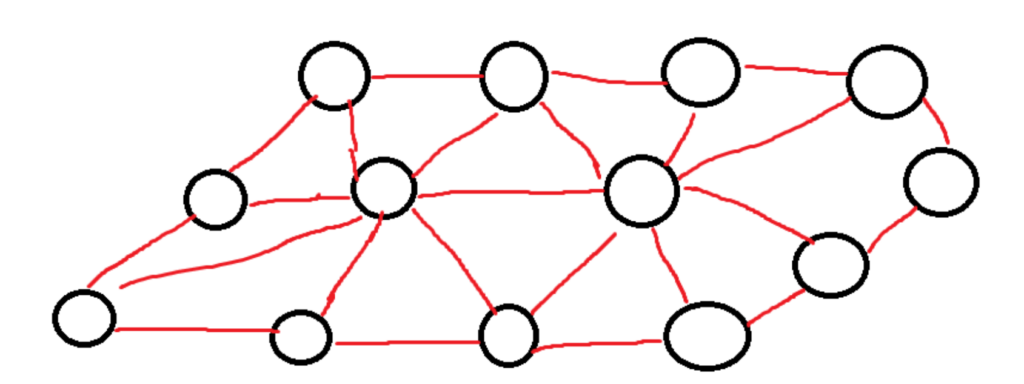
When attempting to interpolate, it is best to look at values that are close to the current value. A valley that is really far away doesn’t provide very much information. But if this point is inches away from a super-tall mountain, it gives us a lot of information on the most probable height. When recording the heights, they were given in an ordered triple (x,y,z). For now, it is best to visualize it in two dimensions. When it comes to comparing the right data points, the entire data set should be triangulated. The definition of a triangulation is the maximal planar subdivision where no edges are crossing. If the shape is a simple polygon, it is always possible to break it down into triangles. The obvious observation is that all of the inner faces are triangles, and if I drew lines straight to the outside, they would be the complement of a convex polygon.
Extra Information: A triangulation will always include 2n-2h triangles and 3n-3h edges.
Good and Bad Guesses:
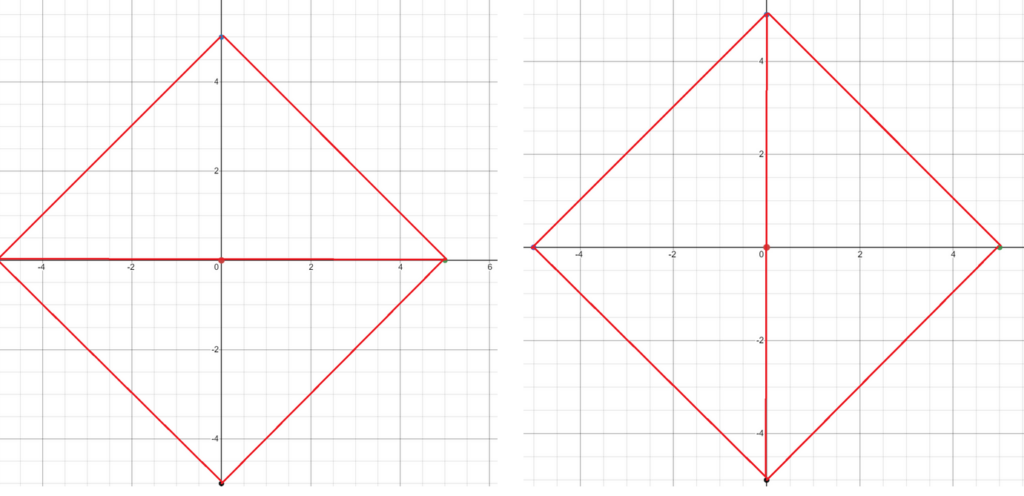
How a simple polygon is triangulated is not unique. There are multiple different ways to triangulate. There exist good triangulations which give good estimations and there are bad triangulations which produces values far from the real answers. Each triangle section with be interpolated. Look at the following an example where a simple line switch changes the entire map. One of them is a horizontal stretching valley and one of them is a vertical mount range.

Which one is better?
With the use of angle vectors, two different Delauney triangulations can be compared. Overall, skinny triangles should be avoided. So, in good cases, the angles will be as close to equal as possible. An angle vector contains every single angle in the entire triangulation, sorted in increasing order. To compare two triangulations, compare the angle vectors. The first place where the angle vectors disagree will determine which is better. The triangulation with the greater value is considered to be a better triangulation. Refer to the previous images.
Triangulation One: <30,30,30,30,120,120>
Triangulation Two: <60,60,60,60,60,60>
In this scenario, they happen to be different at the very first value. Triangulation 2 has the bigger value, so it will be considered the better triangulation.
Computing the Delauny Triangulation:
Computing the Delauney triangulation isn’t that easy. Figuring out a D.T. will require the use of Voronoi diagrams. Voronoi diagrams are diagrams with a bunch of cells. Inside each cell, there will be a point; everything inside the cell represents the area under control of that point. A point has control over an area if, at that spot, there are no closer points. There is an article on this website that explains much more in the same section. Computing the Voronoi diagram will take O(n log(n)) time. The Voronoi diagram will be used using the data points of the heights at different locations.
The following image is not mine but from the following video (sourced at the end). Delaunay Triangulation (4/5) | Computational Geometry, Lecture 08, YouTube
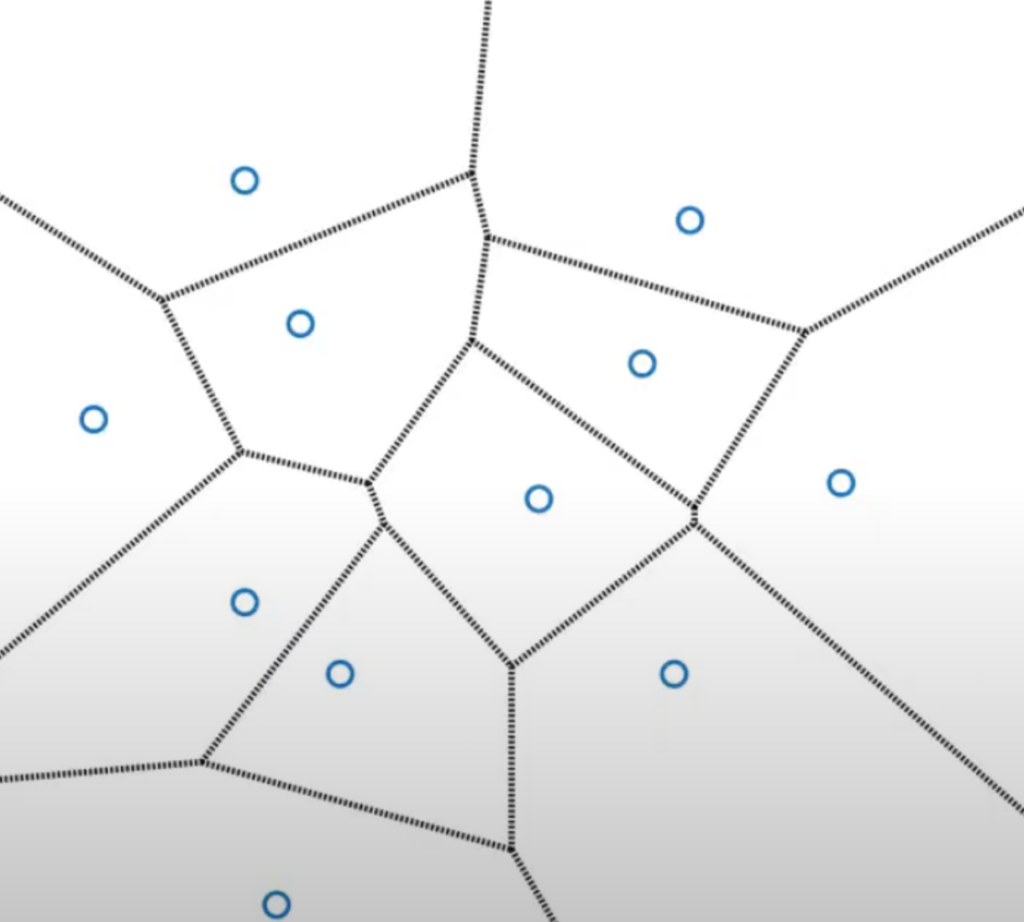
To get closer to the creation of the Delauny triangulation, the dual graph needs to be constructed. In the dual graph of a Voronoi, there are edges between two nodes if the two nodes cells share an edge in the Voronoi diagram. After all of the connections are made, all of them should be reduced to lines (since triangles can’t be curved lines). Some lines were able to be included in the image. But, by definition, the Voronoi lines are located in places where two points are equally distant from them. Some cells for each point might go on forever, which is why some edges look like they aren’t adjacent. The side that they share just isn’t in the image.
The following image is not mine but from the following video (sourced at the end). Delaunay Triangulation (4/5) | Computational Geometry, Lecture 08, YouTube
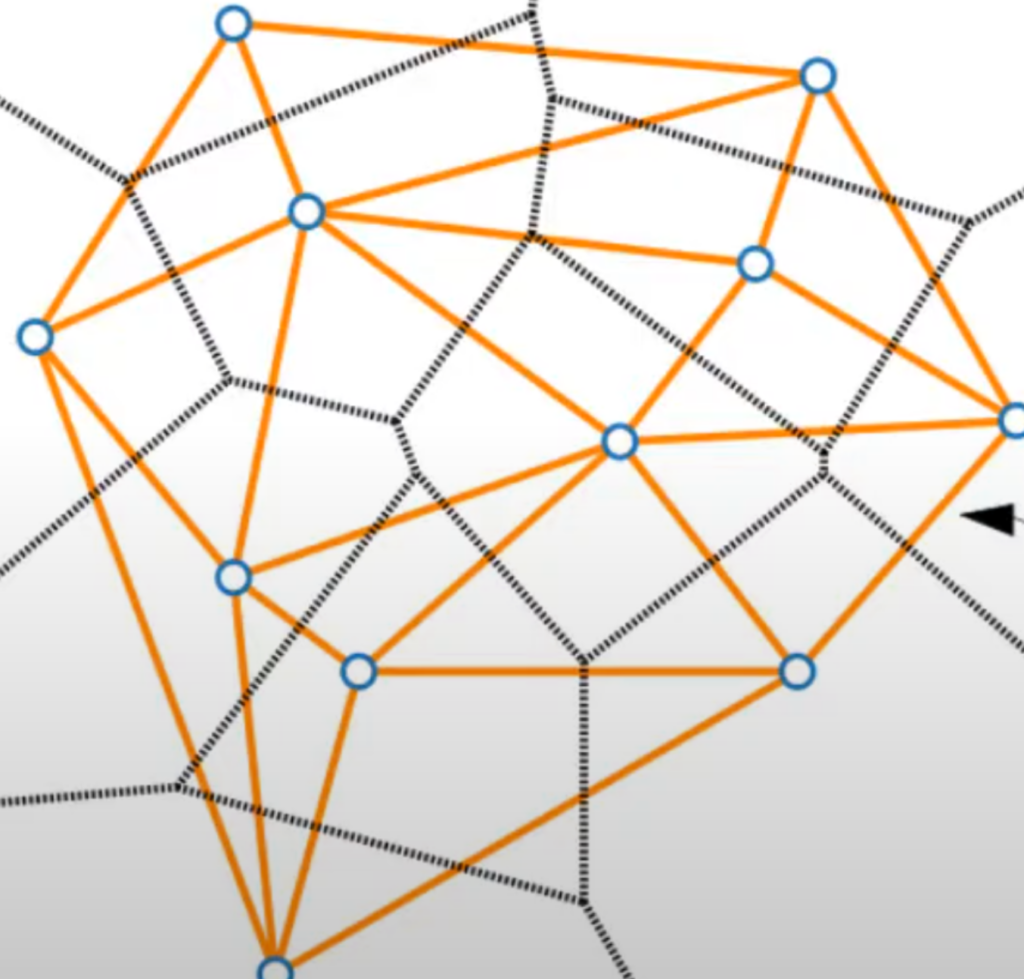
Now, after straightening out the lines, the Delauny graph is finally constructed. In this case, the graph worked out perfectly. Sometimes, the graph will not be made up of only triangles. The occasional squares might show up; in that case, a little more work needs to be done. A Voronoi vertex is a vertex in the Voronoi diagram that is equally distant from the points that the diagram is constructed from. For each Voronoi vertex, find the distance from one of the nearest points. Generate a circle of that distance, and if there are more than 3 points on that circle, then some parts still need to be triangulated.
Now the method that was used to determine which configuration is better can be used. Using the angle vectors, you can determine the best way to triangulate the non-triangle.
