Problem Description
Let’s say there is a two-dimensional space where nodes are thrown around everywhere. A query will give an ordered pair of locations somewhere in the same 2D space. Return the closest node.
The problem solver is simple when an O(n) per query is allowed. Simply looping over all of the nodes and using the distance formula will produce the correct answer. There is also another data structure that could be used to determine the closest point, which is called a KD tree, which is able to do the problem in O(log n) per query. But there might be another way where the closest point is already determined at every position. Making a query is more or less a matching task.

Simpliest Scenario:
The strategy is to precompute the areas that each node has “control” over. If a node X has control over an area than if any value in its control area will return node X as the closest node. It is possible for multiple differnt sites to have control over the same position but, that will be disucssed later. In the scenario of one node it has control over the entire space. But, how do we deal with when there are two nodes. The red nodes represent the the different nodes.
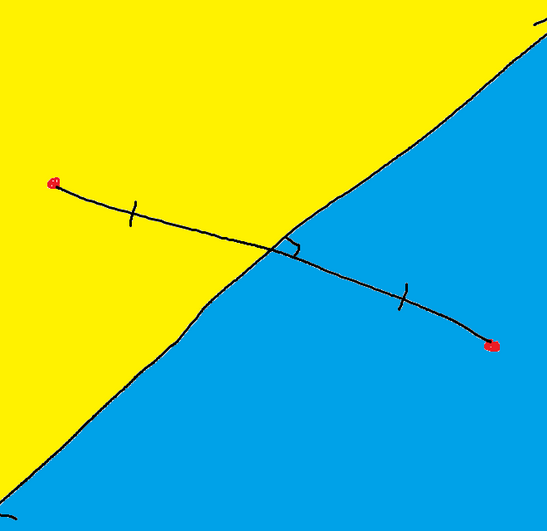
When it comes to a scenario where there are only two nodes a little bit of geometry willl solve the entire problem of splitting it up into differnt sections. The line that divied the two will be at the perpendicular bisector of the line segment between the two nodes.
It takes the middle of the line segment. Then, it draw a line with is perpendicular (intersect at 90 degrees).
The blue region clearly belongs to the right node and yellow region cleary belongs to the left node. But, what about the line that seperate there two regions? If a query was to exist on that line either node which be the closest node.

Some things to know:
Terminology:
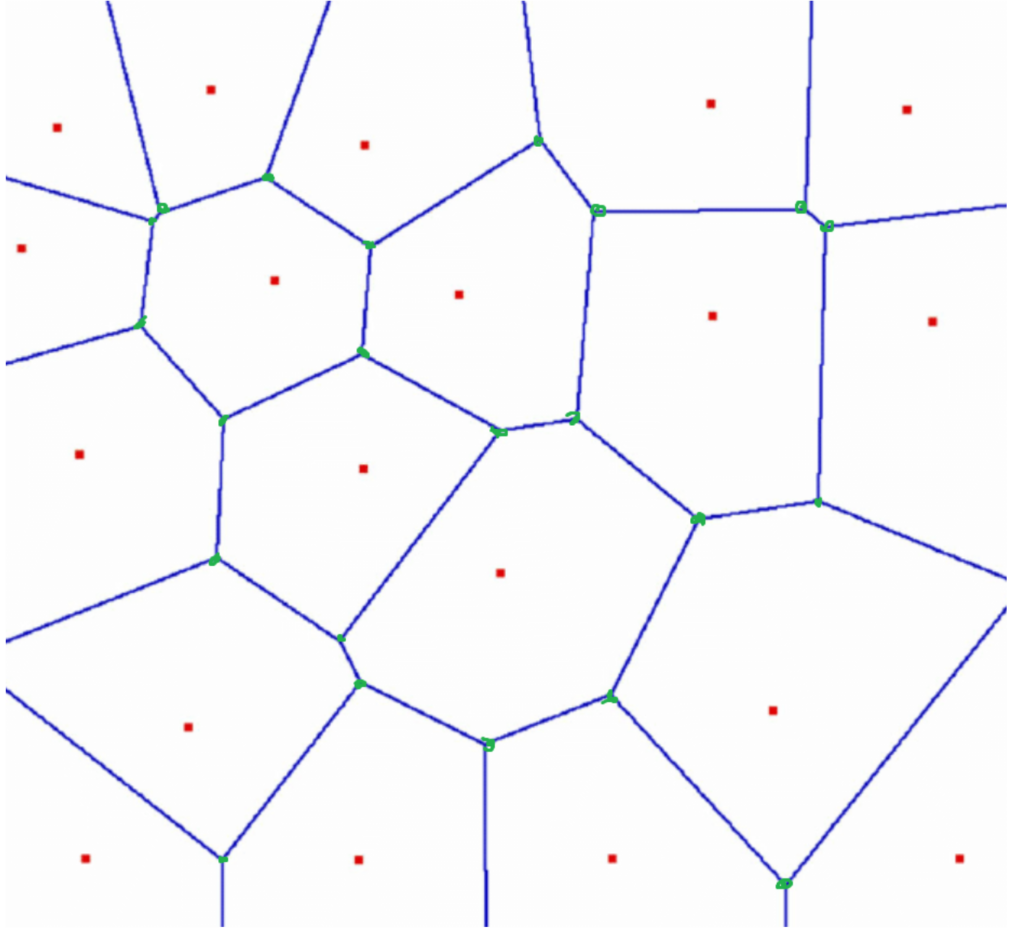
Voronoi Cell: A voronoi cell is an area in the graph that has the same closest node. The values on the very edge of the Voronoi cell are not included (white space and a red dot, which is the node).
Voronoi Edge: The voronoi edge exists when there are two nodes that could either be the closest node (blue lines).
Voronoi Vertex: A voronoi vertex exists when there are three or more nodes that could be the closest node. (Green Circles)
The following image is not mine and is taken from this link: https://www.researchgate.net/figure/An-example-of-a-Voronoi-diagram_fig1_220066380.

Constructing the Voronoi Diagram:
Unfortunately, constructing a voronoi diagram is a very easy task. First, it’s important to find the voronoid vertices. Some of the first ideas were to use line segment intersection or half-plane intersection (also talked about in this section). However, both of these aren’t able to produce the best time complexity. Using a line sweep and comparing the closest nodes might work, but a lot of backtracking will be needed due to how it works. Line sweeps work from top to bottom, but in a voronoi diagram, one of the nodes that creates a voronoi vertex might appear below.
In the current line sweep (purple line), it has found the two nodes, which are the ones with the orange arrow. We know that these two nodes will form a Voronoi vertex at the circled green point. But the computer is unable to identify this until it goes further down and then backtracks back up. The third node, which makes it a voronoi vertex, will not be seen. When the third node is finally found, it searches through so many new nodes that were found.
How do we reduce how much needs to be searched?

Algebra II and Conic Sections:
In order to better determine where the voronoid vertices and edges exist, some algebra II mathematics is needed. In order for a voronoi vertex to exist, there needs to be at least three equidistant nodes. Before, in our sweep line, everything above the line had to be considered as possibly being part of a Voronoi vertex group. But clearly, not everything needs to be considered for each node.
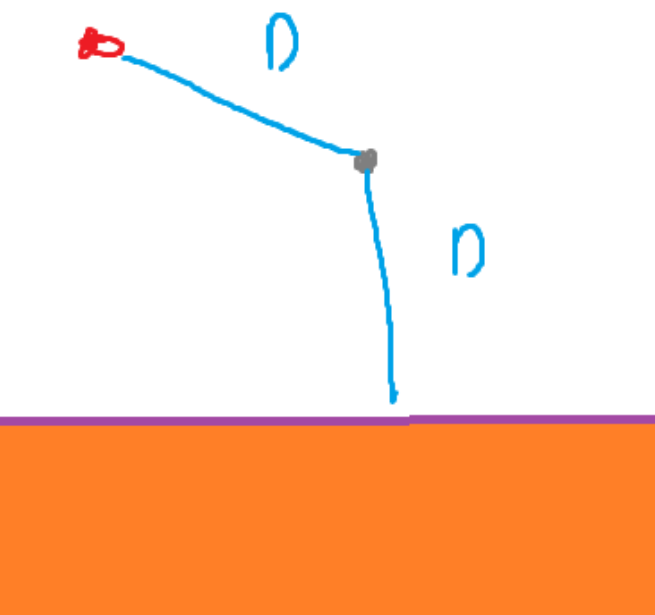
if the purple was the sweep line. where D is the distance from the sweep line to a potential voronoi vertex. Anything in the orange doesn’t need to be considered as a possible pairing with the red node for the gray voronoi vertex because its length from the vertex must be greater than D.
It is possible for nodes to be farther than a distance of D, even above the sweep line. The spots where the red node and sweep line are equidistant are on a parabola. The red node is the focus of the parabola, and the sweep line is the directrix.
More information (I do not own the following video): https://www.youtube.com/watch?v=KYgmOTLbuqE
When all the parabolas are put together, the bottom edge is called the beachline. outlined in orange.

Directrix and our Line Sweep

What does this all mean?
Here is a simulation of the Voronoi diagram creation on Desmos: https://www.desmos.com/calculator/0b96jkosm2
There is also a very well-done animation of the algorithm: https://www.youtube.com/watch?v=k2P9yWSMaXE&t=0s.
Remember that each parabola represents the spots where the sweep line is equidistant from the focus and directrix. When there is an intersection of two parabolas. Means their foci are the same distance away from each other. This means there must be an edge there. The following statement can be observed on the Desmos link:
Now what if there is a three-way intersection? That must mean that there is a Voronoi vertex there.
Specifics:
When looking at the beachline, there are some “break points”. Which is when it swithches from one arc to another. The breakpoints are also the same objects that trace out the voronoid edges. New arcs are only introduced when a new point is found by the sweep line.
Circle events: A circle event occurs when the sweep line is at the bottom of a circle of radius D, which contains three nodes. Thus, the center of the circle is the voronoi vertex, as it is equidistant from three nodes. Arcs will also start to disappear whenever these events occur.
When line sweep finds a new node:
I do not own the images on the left. It was a screenshot taken from the following video: https://www.youtube.com/watch?v=9RevQMBDTLc&list=PLubYOWSl9mIvTio-1bXWnhE9LdeXfox1z&index=35
When the line sweep finds a new node, compare it to the arc above it. When it comes to the beach line, the new node will split the parabola directly above it.
Now that the new parabola is expanding, It will start to make new voronoi edges with a0 and a2 with a1.
Due to the position of a voronoi diagram, Circle events (potentially finding a voronoi vertex) might have occurred. So, a circle event must be tested for a0, a1, and a0’s left neighbor. as well as a1, a2, and a2’s right neighbor.

Handling Circle Events:
Figuring out whether there is a circle event. Three arcs need to be compared to see if there is a point where there is an intersection of all three. Every time there is a circle event, one of the parabolas will no longer be a part of the beachline. In this case, this is arc a. This also means that arc a will no longer need to be considered as a possible candidate for voronoi vertex grouping.
Now that arc alpha is gone. Two new arcs might start creating a voronoid edge. So, now the left and right voronio’s edges need to be considered.
New circle events may have also been created. So, possible circle events may need to be checked for a left, a right, and a left’s left neighbor. as well as a left, a right, and a right’s right neighbor.
With all these calculations, this will yield an O(n log n) time complexity to get the voronoi diagram.
